

Monitoring and logs
The console
- Overview: the host's CPU, memory and disk, with history, the free memory share, the Docker version (the page says when Docker cannot be reached), and how many workspaces have an update available.
- Workspace page: CPU, memory, network and block IO per workspace, with the last 240 samples, plus the data volume's size. The sampling interval is
ORC_STATS_INTERVAL_SECONDS(15). - Logs tab: the container's log, followed live, with a filter and a tail size. Download the full log saves all of it.
- Activity: what the Orchestrator did and why, across all workspaces or filtered to one.
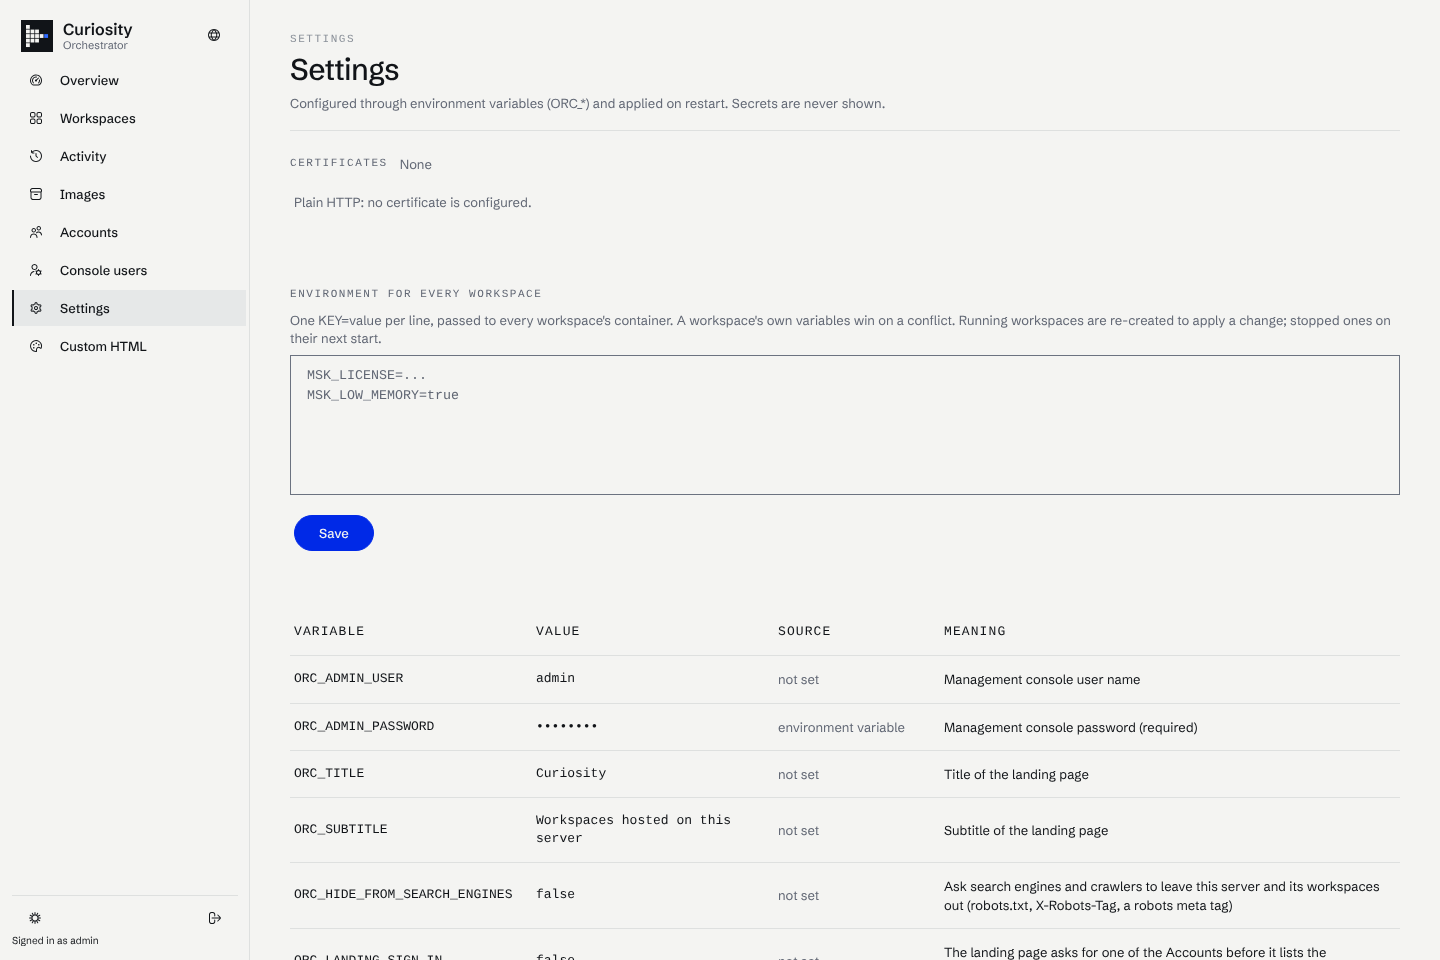
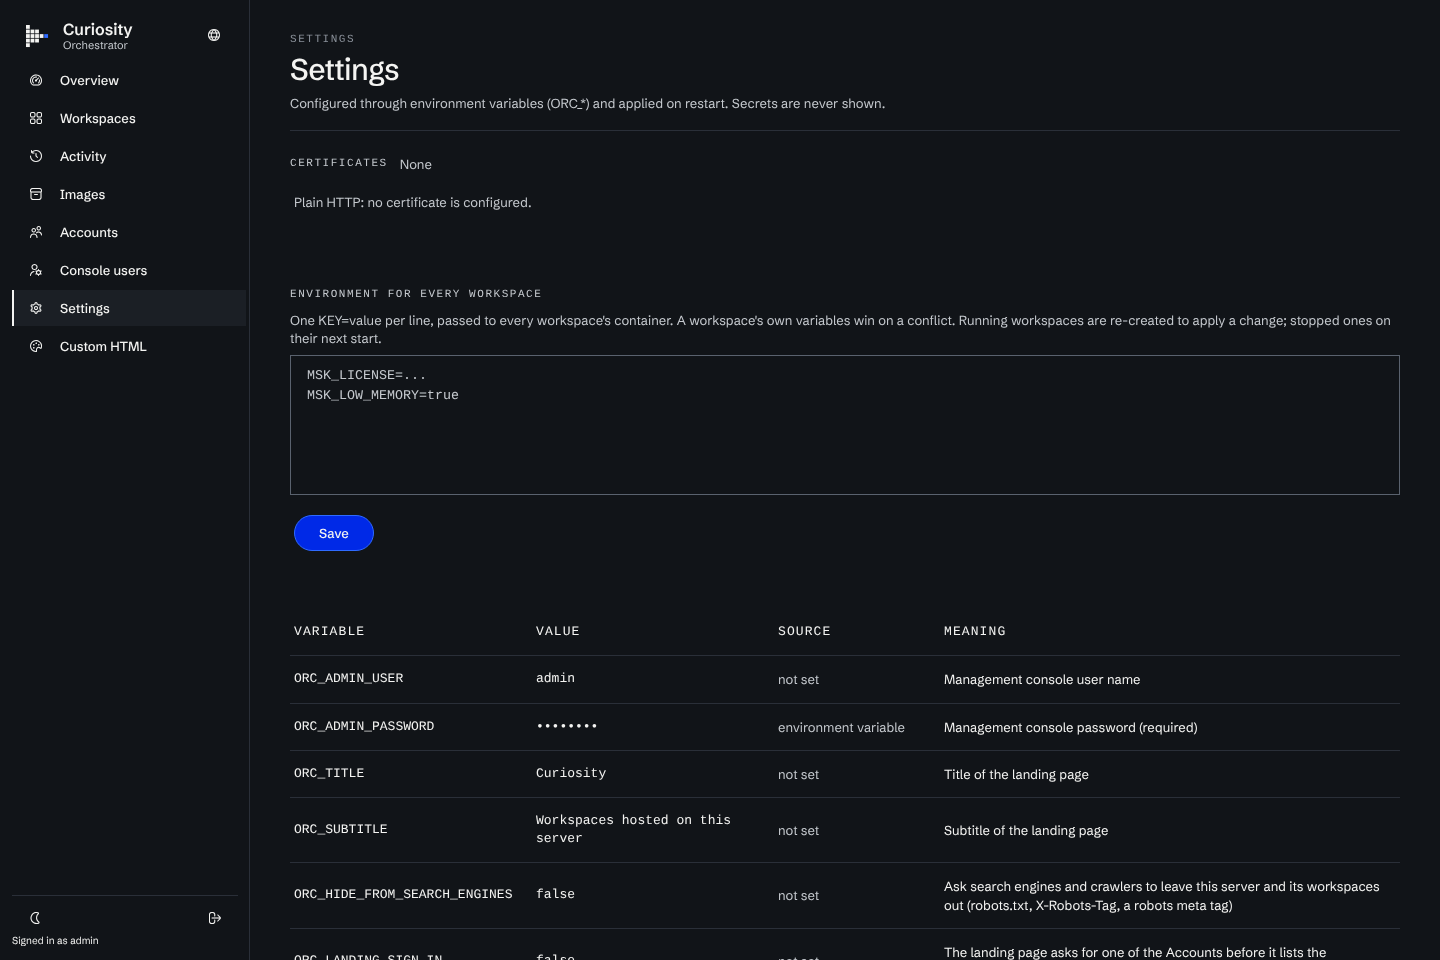
- Settings: the effective value of every setting and where it came from (environment, argument or file), with secrets masked, plus the HTTPS certificate list.
The Orchestrator's own log
The Orchestrator logs to standard output at ORC_LOG_LEVEL (Information). Under systemd, read it with journalctl -u curiosity-orchestrator -f. In Docker, docker logs -f curiosity-orchestrator. It logs which certificate source it uses, Docker connection errors, fleet events and Let's Encrypt results.
Health
GET /health answers ok with status 200 when the process is serving. It does not check Docker. For more, call GET /api/admin/overview with the API token. It returns the Docker version, the host's memory and disk, and how many workspaces exist and run.
curl -f http://localhost:8080/health
A request to <slug>.<host>/health is forwarded to the workspace. The proxy matches subdomains before anything else, so use the Orchestrator's own host name for the health check.
Scripting the numbers
# host CPU and memory history
curl -H "Authorization: Bearer $ORC_API_TOKEN" https://example.com/api/admin/stats
# one workspace's history
curl -H "Authorization: Bearer $ORC_API_TOKEN" https://example.com/api/admin/instances/acme/stats
# the last 200 activity entries for a workspace
curl -H "Authorization: Bearer $ORC_API_TOKEN" "https://example.com/api/admin/events?slug=acme&max=200"
# certificates
curl -H "Authorization: Bearer $ORC_API_TOKEN" https://example.com/api/admin/https
The Orchestrator does not export Prometheus metrics. Poll the endpoints above from your own tooling.