MNIST scatter plot
A full end-to-end example: take 10,000 vectors from the MNIST handwritten-digit dataset (resized to 10×10 = 100-D), project to 2-D with UMAP-Sharp, and render two scatter plots — one labelling each point with its digit, one colouring each point by its digit.
This is the same example shipped as the Tester project inside the umap-sharp repository.
Expected output
After running the program you get two images. The first labels each point with its digit; the second colours each point by its digit.
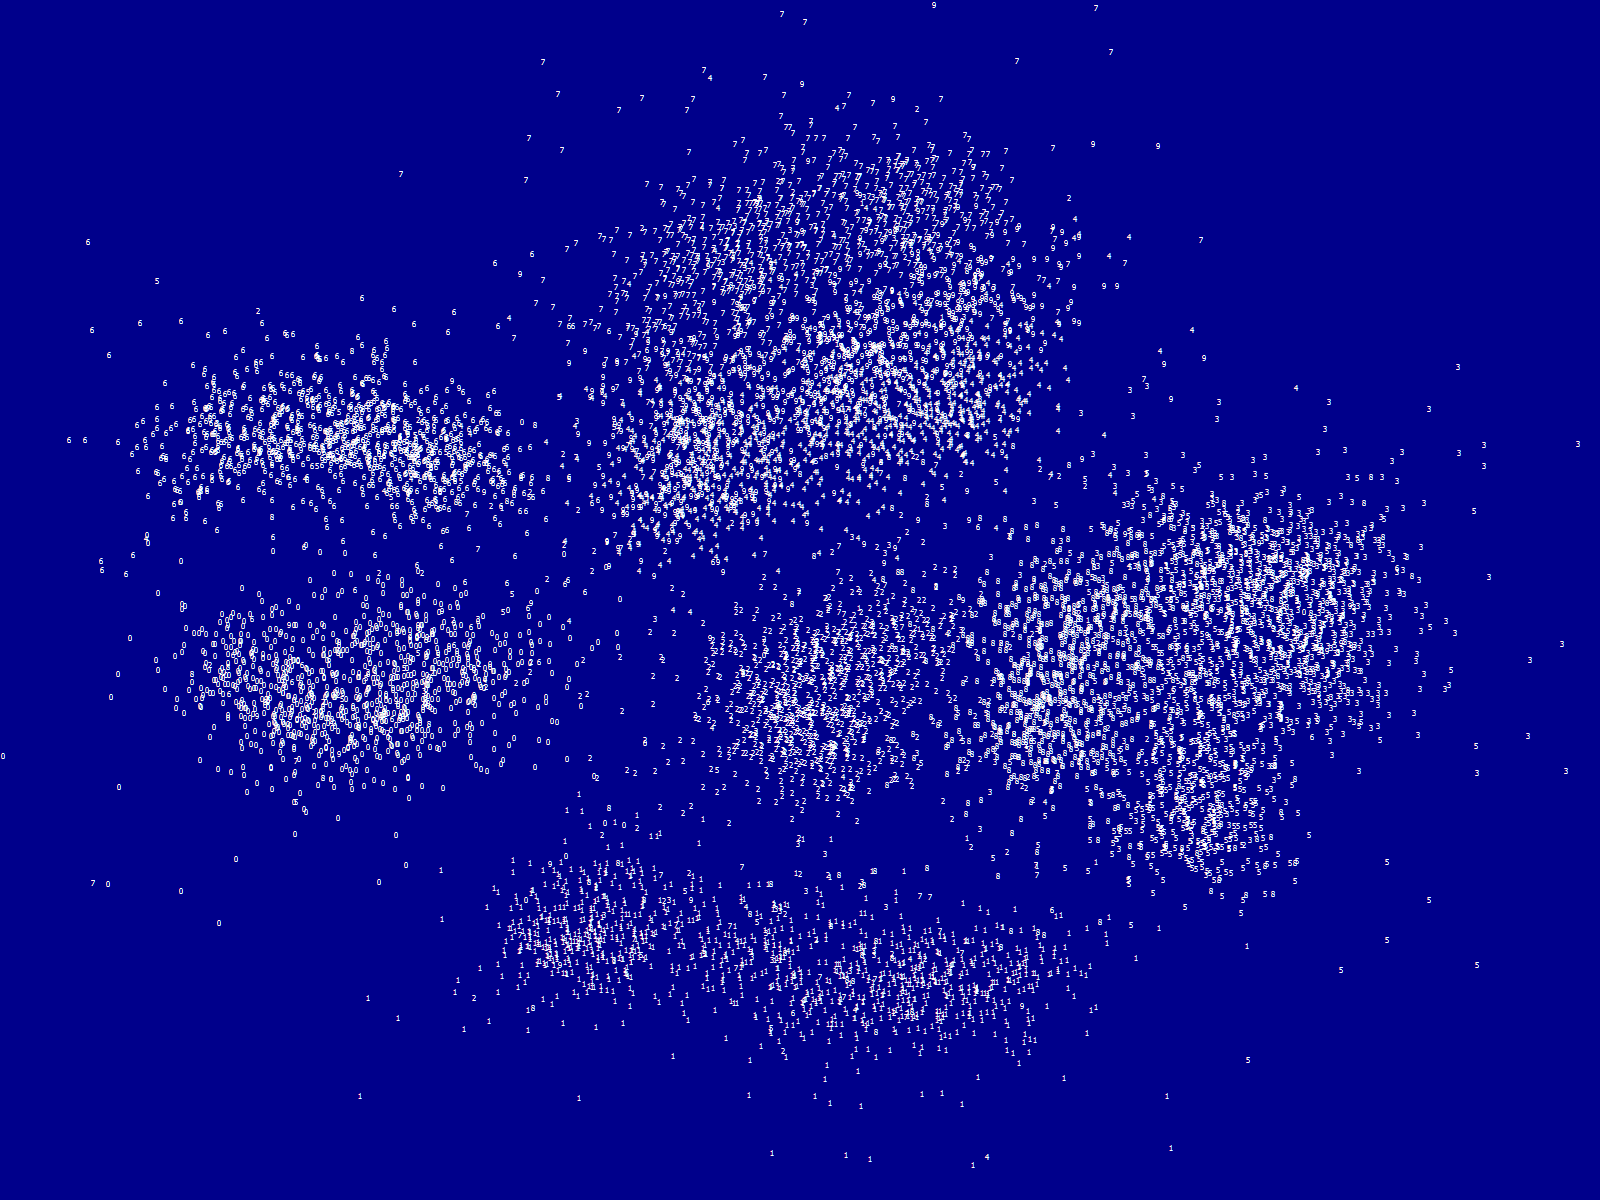
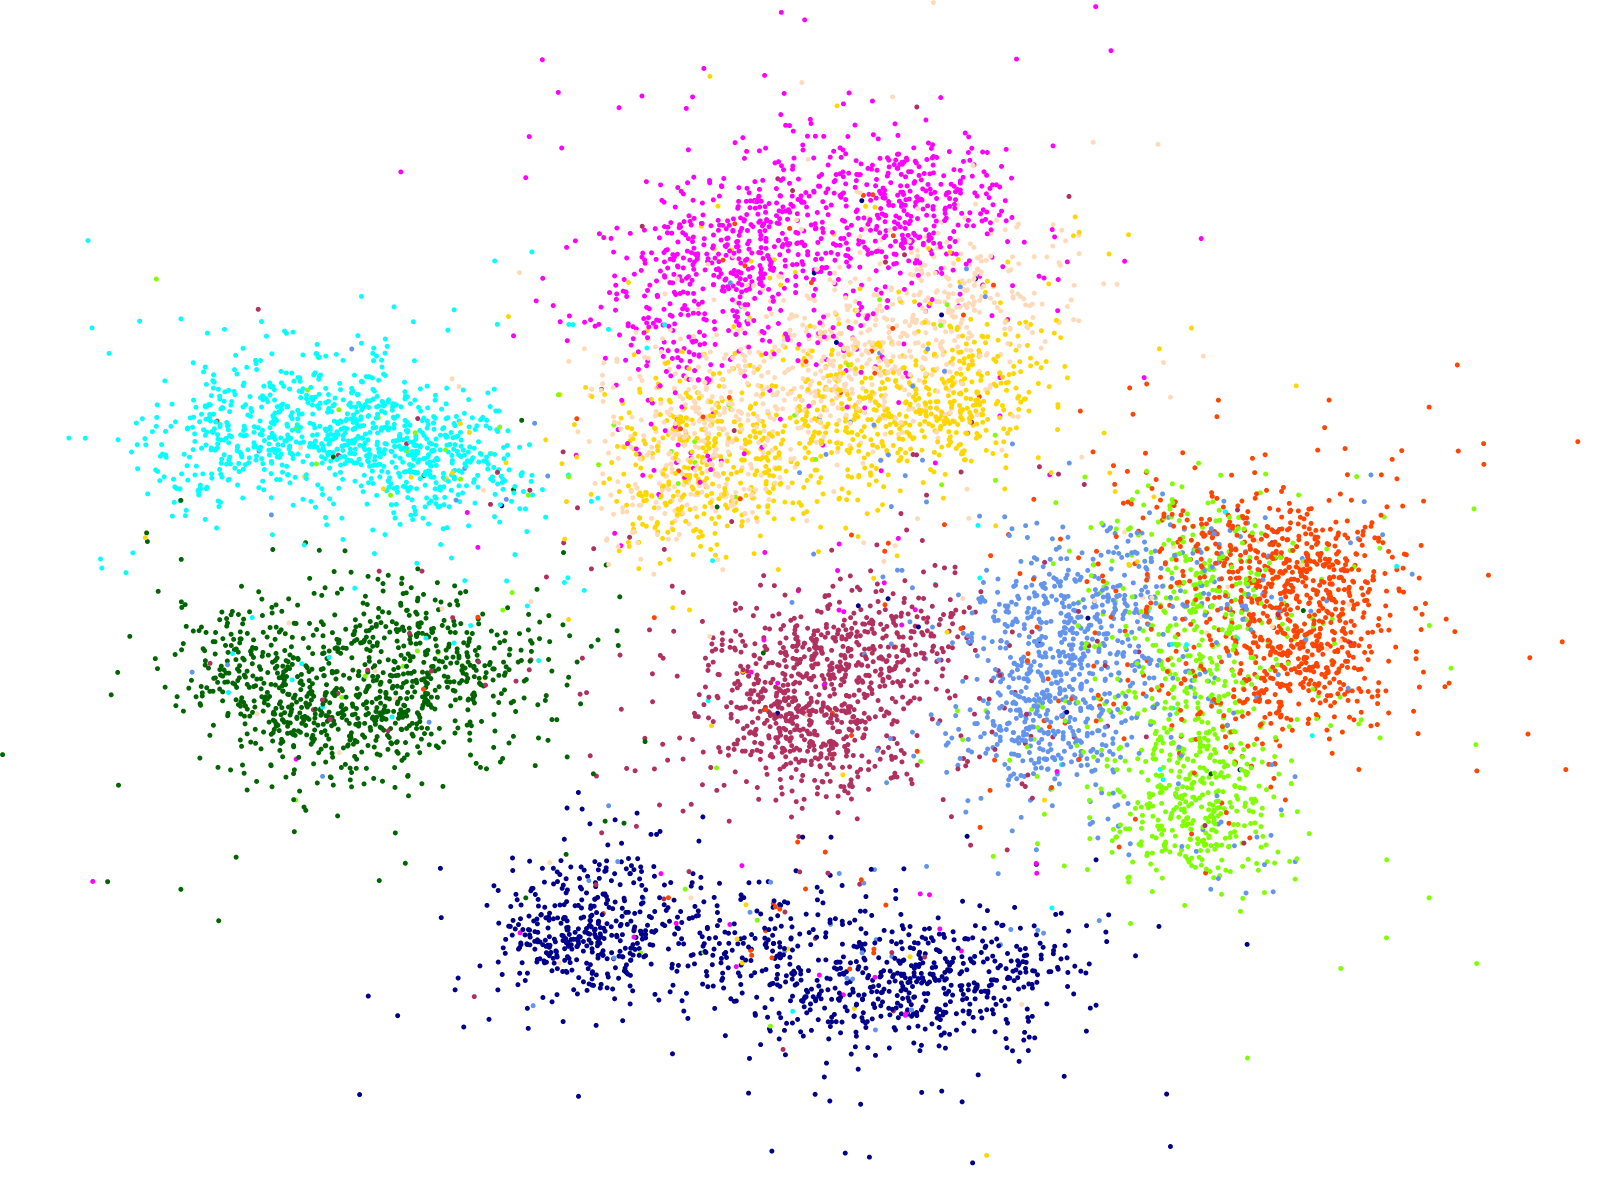
UMAP has rediscovered the digit classes from raw pixel similarity, without any labels.
Setup
The example uses three packages: UMAP-Sharp, MessagePack for loading the pre-serialised dataset, and System.Drawing.Common for image output.
dotnet add package UMAP
dotnet add package MessagePack
dotnet add package System.Drawing.Common
The MNIST data file shipped with the repo — MNIST-LabelledVectorArray-60000x100.msgpack — contains 60,000 vectors, each a normalised 100-element float[] plus a string UID (the digit "0" through "9"). Grab it from the repo and place it next to your executable.
The complete program
using System;
using System.Diagnostics;
using System.Drawing;
using System.Drawing.Drawing2D;
using System.Drawing.Text;
using System.IO;
using System.Linq;
using MessagePack;
using UMAP;

// 1. Load the data — 60,000 vectors, take the first 10,000.
//    The vectors are already unit-normalised, so we can use the
//    faster CosineForNormalizedVectors distance.
var data = MessagePackSerializer.Deserialize<LabelledVector[]>(
    File.ReadAllBytes("MNIST-LabelledVectorArray-60000x100.msgpack"));
data = data.Take(10_000).ToArray();

// 2. Run UMAP.
var timer = Stopwatch.StartNew();
var umap = new Umap(distance: Umap.DistanceFunctions.CosineForNormalizedVectors);

Console.WriteLine("Initialize fit...");
var nEpochs = umap.InitializeFit(data.Select(e => e.Vector).ToArray());

Console.WriteLine("Calculating...");
for (var i = 0; i < nEpochs; i++)
{
    umap.Step();
    if (i % 10 == 0)
    {
        Console.WriteLine($"- Completed {i + 1} of {nEpochs}");
    }
}

var embeddings = umap.GetEmbedding()
    .Select(v => new { X = v[0], Y = v[1] })
    .ToArray();

timer.Stop();
Console.WriteLine($"Time taken: {timer.Elapsed}");

// 3. Rescale (x, y) to a 0-1 range for plotting.
var minX = embeddings.Min(v => v.X);
var rangeX = embeddings.Max(v => v.X) - minX;
var minY = embeddings.Min(v => v.Y);
var rangeY = embeddings.Max(v => v.Y) - minY;
var scaled = embeddings
    .Select(v => new { X = (v.X - minX) / rangeX, Y = (v.Y - minY) / rangeY })
    .ToArray();

const int width = 1600;
const int height = 1200;

// 4a. Text-labelled image.
using (var bitmap = new Bitmap(width, height))
{
    using var g = Graphics.FromImage(bitmap);
    g.FillRectangle(Brushes.DarkBlue, 0, 0, width, height);
    g.SmoothingMode = SmoothingMode.HighQuality;
    g.TextRenderingHint = TextRenderingHint.ClearTypeGridFit;

    using var font = new Font("Tahoma", 6);
    foreach (var (vector, uid) in scaled.Zip(data, (v, e) => (v, e.UID)))
    {
        g.DrawString(uid, font, Brushes.White, vector.X * width, vector.Y * height);
    }
    bitmap.Save("Output-Label.png");
}

// 4b. Colour-coded image.
var colors = "#006400,#00008b,#b03060,#ff4500,#ffd700,#7fff00,#00ffff,#ff00ff,#6495ed,#ffdab9"
    .Split(',')
    .Select(c => ColorTranslator.FromHtml(c))
    .Select(c => new SolidBrush(c))
    .ToArray();

using (var bitmap = new Bitmap(width, height))
{
    using var g = Graphics.FromImage(bitmap);
    g.FillRectangle(Brushes.White, 0, 0, width, height);
    g.SmoothingMode = SmoothingMode.HighQuality;

    foreach (var (vector, uid) in scaled.Zip(data, (v, e) => (v, e.UID)))
    {
        g.FillEllipse(colors[int.Parse(uid)], vector.X * width, vector.Y * height, 5, 5);
    }
    bitmap.Save("Output-Color.png");
}

Console.WriteLine("Generated visualisation images");

[MessagePackObject]
public sealed class LabelledVector
{
    [Key(0)] public string UID;
    [Key(1)] public float[] Vector;
}
What's interesting about this example
A few things to notice in the code above:
- Normalised vectors enable the fast cosine kernel. The MNIST vectors in the data file are pre-normalised, so the example uses
CosineForNormalizedVectorsinstead of the defaultCosine. See Distance Functions. - The rescaling step is for the static image only. If you were sending the embedding to Plotly or another interactive plotting library, you could skip it — Plotly scales the axes to the data automatically.
- The
UIDfield carries the label through. UMAP preserves row order, so zipping the embedding back with the original labelled vectors works without any bookkeeping. - Wall time scales with both data size and CPU. 10,000 points on a typical 8-core machine takes single-digit seconds. The default multi-threaded mode is doing the heavy lifting — see Parallelization.
Going 3-D
Change one constructor argument and one output line and you have a 3-D embedding ready for Plotly:
var umap = new Umap(
    distance: Umap.DistanceFunctions.CosineForNormalizedVectors,
    dimensions: 3);

// ... after the fit + step loop ...

var embedding3d = umap.GetEmbedding()
    .Select(v => new { X = v[0], Y = v[1], Z = v[2] })
    .ToArray();
For details on rendering this with Plotly, see 3-D Projections.
Next
- Back to the Usage Guide — configuration knobs, distance functions, and 3-D projections.
- Advanced Topics — parallelization, progress reporting, reproducibility.